
Main
Index of the Weekly Forecast & Review
Ultrapolis
Weekly Forecast & Review
Wednesday, March 3, 2010
© Copyright 2010, The Ultrapolis Project – May be used freely with proper
attribution. All other rights reserved.
How
Rising Home Prices Steal Your Wealth
A Mob of Politicians, Corporations, and Ideologues Reach for
Your Back Wallet
If You Want to Raise Home Prices, Raise
Your Hand
It is the common misconception that continuously rising home prices are good for the economy, and good for homeowners. Some even argue that it’s good for home buyers because they can count on rising home prices. Beyond that, homeownership has taken on the quality of a birthright (as healthcare is doing), where Americans no longer see it as a personal goal to achieve, but as a social entitlement to be facilitated or fulfilled by government. And so, we have had Fannie Mae, Freddie Mac, the FHA, and countless other programs to help people buy homes that also have the ‘happy’ side-effect of pushing up home prices. And yet, the reality is that home prices are an insidious way to rob the average American of real wealth, and have it transferred to a collection of mortgage brokers, realtors, developers, home-builders, real-estate attorneys, bankers, loan officers, investment brokers, CEOs, and low-income folks – a considerable constituency, to say the least. No wonder these programs are so adamantly defended by the likes of Rep. Barney Frank, D-Massachusetts, and chairman of the House Financial Services Committee, even in the face of accusations in the mid-2000’s that they were feeding a housing price bubble founded on shaky loans. Of course, for the likes of Barney Frank, supporting these homeownership programs are good for his bottom-line, as a recipient of generous donations from the very corporate agencies subject to the legislative oversight of his committee.
But, how do rising home prices, rising faster than average wages as they did from 2000 to mid-2006, hurt the average person who is not involved in the above-noted trades? Let’s do the math. From 2000 to 2006, house prices rose at about an average of 10% a year, while wages rose at roughly 3% a year (this varied widely from city to city). This resulted over six years in houses almost doubling in price, while wages rose about 20% over the same period, not factoring for inflation (after factoring for inflation, wage gains were flat; and after factoring for the dollar’s fall in that period, we lost ground). Now, if you owned a house at the start of this entire period, you certainly were better off than those who bought later. However, you still lost purchasing power vis-à-vis buying a larger home. Assuming some average numbers for our example, this is what happened to your purchasing power in relation to buying a bigger home:
In each
scenario, in the year 2000 you owned a home that you bought for, and was valued
at $200,000; and you planned to move up to a bigger house later, a house that
was valued in 2000 at $300,000. The three scenarios then take you through the
same six years that followed, with only the rate of increase (or decrease) in
house prices changing. In the first
scenario, we have what happened on average throughout the country (10% annual
increase). In the second, we assume a
rate equal to the rate of wages increases.
In the last, we assume an annual decline in prices.
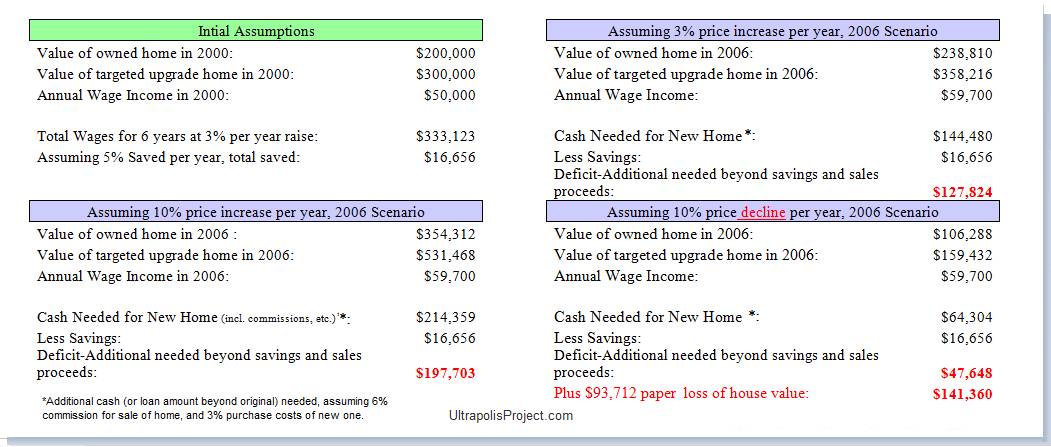
In the different scenarios above we show what happens to your true purchasing power, when house prices rise faster than your wages, and how you fare even when they fall, assuming you are staying within the same market. If you were hoping to move up to a nicer home in the same market, all other things being equal, you actually fell behind through 2006, and then regained some ground as prices fell, so long as prices did not fall below your initial house value. But, even if prices fall below your initial house value, the loss is greatly offset by the added purchasing power of the dollars you do have, and most of the losses are on paper only - your ability to move up to a nicer home is still enhanced. And, the examples above do not take into account additional expenses due to higher taxes resulting from higher house appraisals, or the additional monies saved from lower mortgage payments on houses that are cheaper in relation to your wage earnings, which would further exacerbate the loss of purchasing power in a price increase scenario.
However, people are fixated on the numbers on statements, without regard to the real, tangible value of what those numbers actually mean. After all, what good is a million dollars if they can only buy you a hovel? Of course, the scenarios above work conversely. If you plan to downgrade, then rising house prices do work in your favor, because in that case, just as with stocks, you are effectively cashing out when you sell your larger home to trade down. Then again, if prices keep rising, then you begin to lose again.
Of course, price boosters will say
that rising prices are essential for keeping a neighborhood economically
viable. That may be true for modest increases that mirror inflation. But the current state of affairs should
emphatically disprove this theory in general.
The Big Property Ponzi Scheme
So who wins? Anyone (those listed at the top) whose wealth and income rises in proportion to rising property values. While their inflated income and wealth numbers may not seem to actually increase their purchasing power in relation to properties, they obviously do in relation to everything else: cars, boats, vacations, etc. And, since they have more disposable income after all other general and discretionary expenses, they do have more true disposable income, and thus, more real purchasing power, when buying their next dream home. In other words, their wages kept pace with house prices, plus everything else costs them relatively less, thus more money freed up that can be diverted to a new house, adding real house-purchasing power for them. Let us be clear: this is not an assault on the above professions, per se, or on anyone who conducts themselves in the above trades in good faith. This is simply a statement of what is a mathematical fact that people are not (on purpose or thru honest lack of clarity) made to understand. And, let’s be adult about this: It is very hard for human beings to go out of their way and argue against what benefits them financially.
Thus, we have the price bubbles that are fostered by many in the above professions, even when the numbers glaringly don’t add up, warning bells are ringing off the walls, and sirens are blaring their alarms from all corners. There should be no need to explain on this page how the overwhelming majority of those who brought us the financial meltdown caused by the housing bubble escaped with their fortunes intact, while the rest of America paid in the form of huge tax bill to pay for the bank rescues, not to mention those who paid with their lost jobs, lost raises, etc. As far as they are concerned, given the huge payouts for 2009 among those in Wall Street, everything turned out just fine.
Of course, there are realtors, and home-builders and other further down the Ponzi scheme that are now hurting. But such are Ponzi schemes. Those at the top of the pyramid get most of the winnings, those halfway down get some before the scheme inevitably runs into the wall of real math, and those at the tail end slam into it at maximum speed.
Why do we say a Ponzi scheme? There is simply no way the price of ANY item that is dependent on a large and steady supply of buyers, can go up at three times the pace of wages. Sam sells to Johnny who sells to Suzie who sells to Tim, each at annual profit of 10%, but wages are only going up at 3% for each. Eventually, there is no Tim that can afford to pay the hugely inflated price, even if he too is convinced the prices will go up even further, and wants to get in on the deal. Poof, the bubble bursts, the Ponzi scheme collapses. All anyone has to do is do the math, and plenty did warn in the pages of responsible business publications. But, there always was that realtors association president, or that investment broker, assuring all on those same pages that prices could only go up: ‘get on the train before it leaves you behind!”
But Wait, There’s More!
To add to all this speculative fervor we have the government itself, thru Freddie Mac, Fannie Mae, FHA, and its programs that hand out big cash to prospective home buyers. Aside from the now well-known easy credit that many in the banking and investment sectors pushed in Congress, even as they knew (on the record) that this would all blow up, we also have the special programs, such as those through the Community Development Block Grants, that hand out real money to the tune of $19,500 to $45,000 per buyer, for the purchase of new homes, in distressed areas. Beyond that, (there’s more!) there is the new buyer’s tax credit of up to $8,000 per buyer that after its second extension seems on its way to becoming permanent. (Look at your 1040, see how much you paid in tax last year, and then ask yourself why we are going bankrupt as a nation). AND, this does not even take into account the subsidized costs of housing, including house-buying services. Of course, as with all subsidized things (tuition, health, housing), their prices rise faster than inflation. Taken all together, we have a massive government effort dedicated to pushing prices artificially high. So, if you are not a recipient of this government generosity that is open to even to those who have only recently migrated to the U.S., you are paying three ways: Not only in higher taxes, you are also paying in higher interest rates as a result of the government deficit, and then again in even higher house prices.
Is it any wonder we have a line of home builders, realtor associations, et al, at Congressional doors, pounding for more government programs and subsidies? “Do it for the children!” These folks should send you a big thank you note every year –assuming you are one of the fools in the middle who actually pays taxes.
Spinning the Story Yet Again
The bubble has burst, but the story is not over. Repeatedly, news readers will be subjected to the publication of the Shiller Home Price Indices, just released last week with new numbers for 2009. The one you will often see will be like the one below. At a glance, it may appear as if prices were more or less steady, then dropped, and now are on the way steadily up, but still under-priced. “Time to buy again!”
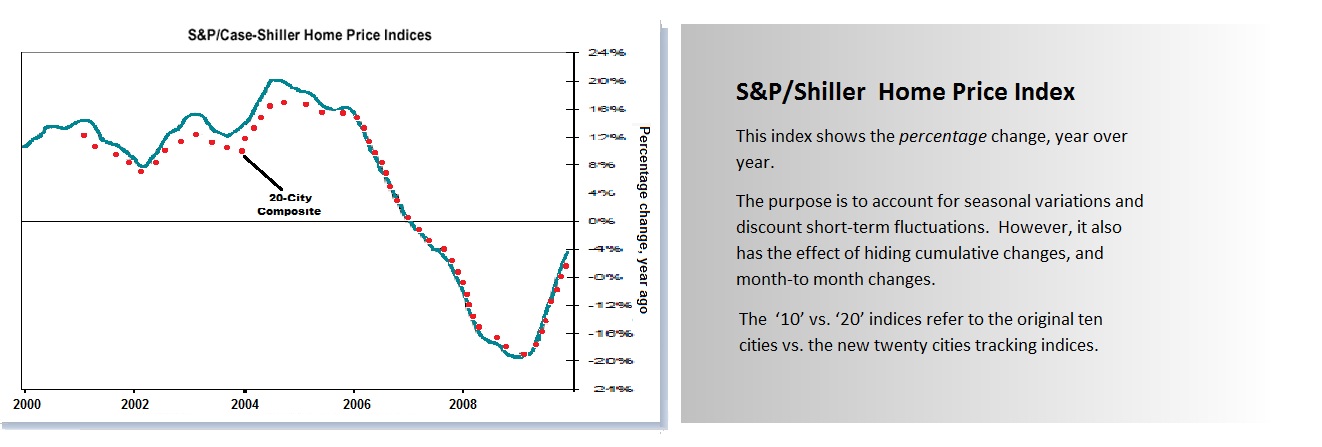
But, look carefully. This chart shows only percentage change year over year. If prices changed at a constant rate of 10 % year over year, it would show up as flat line. And, because it hides cumulative effects, the price bubble is not particularly evident. Lastly, that prominent line in the middle might lead you to conclude that prices are unusually low – and you would be wrong. The chart provides revealing information about price trends, but gives you no perspective of where they have taken us. Please review the second chart below:
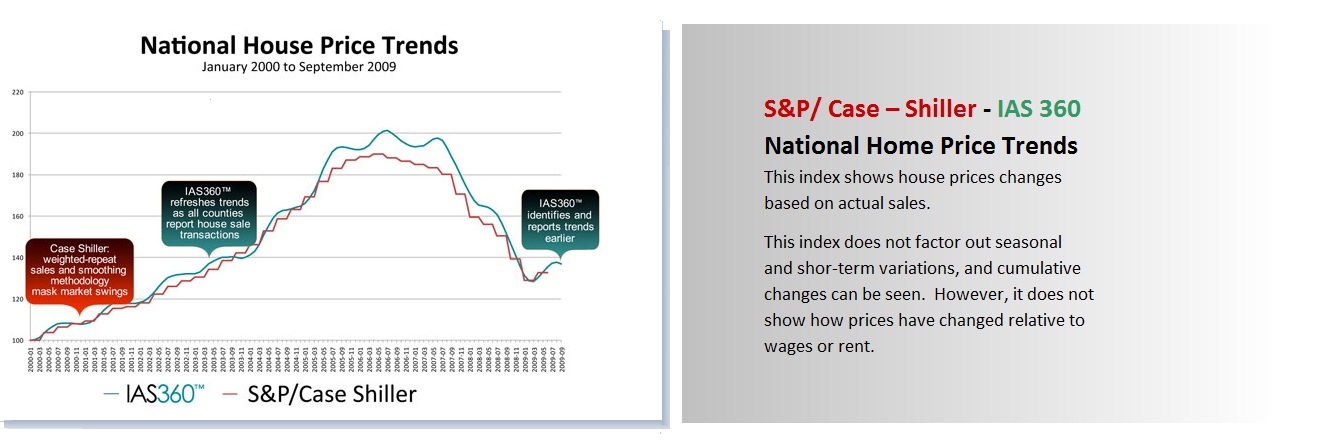
This chart may be of less interest to a realtor, but it provides a more obvious view of the price bubble. Still, since it does not factor out inflation, it does not specifically tell you where prices are in relation to other things. The next chart below reveals a little more:
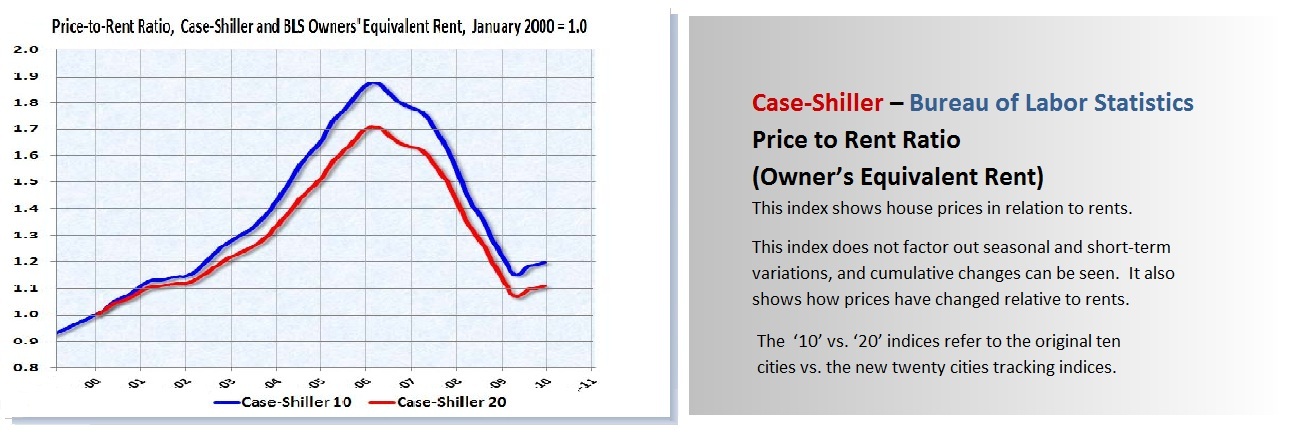
Now we’re getting somewhere. Yes, we can definitely see that price bubble, and yes, home purchase prices definitely grew much faster than rent rates. Still, it does look like the bubble is largely gone, right? Now, let’s took another look at the same chart, but over a longer period:
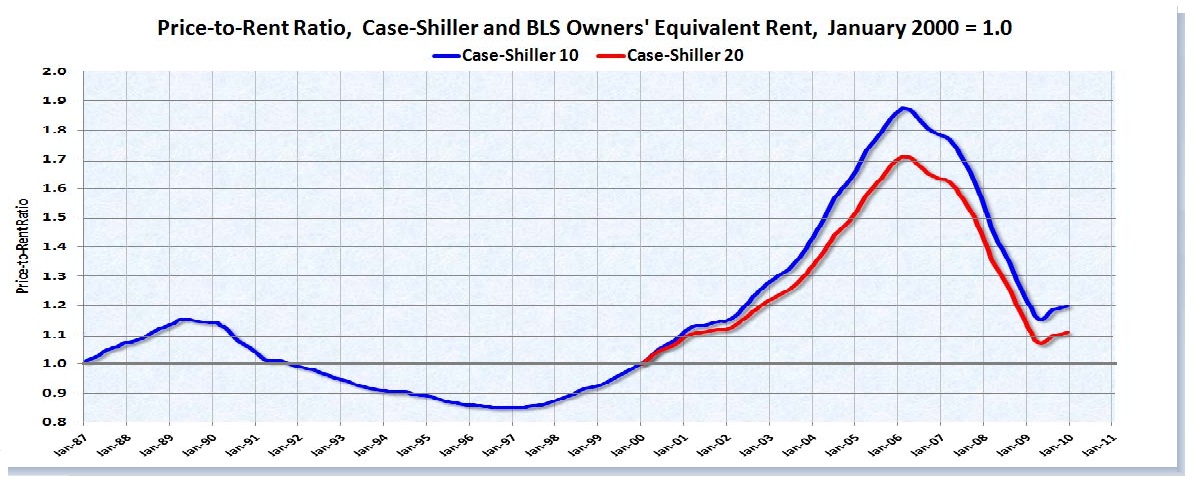
The bubble is mostly deflated, but the home price to rent ratio is still higher than in any year prior to 2003, back to 1987 when measurements began, suggesting prices may still be a little too high. So, we offer you a link to the final chart we would like to bring to your attention. It is strictly copyrighted, so we do not show it here, but it is the most informative of all. It shows where house prices are relative to real income and wages. It is alarming.
http://www.comstockfunds.com/files/NLPP00000%5C298.pdf
Prices are clearly very high relative to income, even after the bubble ‘burst.’ But, why? Why do prices persist? For all the reasons we have described above. There are many, many interests that have an interest in keeping prices climbing as much as possible, and for funding all manner of house-buying subsidies. Those at the top of the Ponzi pyramid scheme know they can escape the occasional inevitable bust’s fallout. Further down, others tolerate the occasional bust because they win more than they lose. Further down, they think they can win most of the time (usually not), or really don’t honestly understand the hard math noted above. But know this: when all these folks are talking to our esteemed legislators about all kinds of programs that take tax money from you to support a real estate and house-building market, and these legislators listen, nobody is really thinking about you.
![]()
Main
Index of the Weekly Forecast & Review
© Copyright 2010, The Ultrapolis
Project
May be used freely with
proper attribution. All other rights
reserved.